|
|
|||||||||||||||||||||||||||||||||||||||||||||||||||||||||||||||||||||||||||||||||||||||||||||||||||||||||||||
|
|
|||||||||||||||||||||||||||||||||||||||||||||||||||||||||||||||||||||||||||||||||||||||||||||||||||||||||||||
|
A
Graphical Representation of How Sensitivity and Specificity Can Be Related
to Prevalence |
|||||||||||||||||||||||||||||||||||||||||||||||||||||||||||||||||||||||||||||||||||||||||||||||||||||||||||||
|
Author:
Lawrence H. Moulton
Abstract
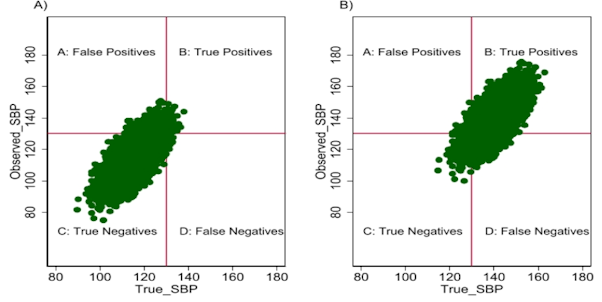
Introduction Demonstration of how sensitivity and specificity can be related to prevalence Consider a population with a distribution of “true” systolic blood pressures (SBP) with mean 115 mm Hg and standard deviation (SD) 6 (Figure 1A). Suppose their blood pressures are then measured with some specified instrument, adding variability so that the SD of the observed measures is 10, but with the same mean of 115, and that the correlation of their true and observed SBP is 0.7. If SBP is defined as being above 130 mm Hg, we can delineate the familiar four areas of Figure 1A as those comprised of A:False Negatives, B:True Positives, C:True Negatives, and D:False Positives. Thus, sensitivity here is given by B/(B+D), and specificity by C/(A+C), where the letters designate the proportion of all the people in each designated area, with A+B+C+D=1. Sensitivity and specificity can be calculated exactly using the bivariate normal function (or approximately using simulation) as 73.8% and 93.7%, respectively. Now suppose we come across a second population (Figure 1B), configured like the first population except now their true mean SBP is 140. We can see that the population is shifted from Figure 1a to 1b by moving the point cloud up and to the right. This results in sensitivity and specificity of 87.0% and 72.5%, respectively. Of particular interest is that this change in the parameters has been effected by changing the true prevalence, B+D, of high blood pressure in the first population from 0.6% to 97.7% in the second population. In the days of transparencies and overhead projectors, this was easily demonstrated by moving two transparencies around on top of each other, one having the point cloud, the other the cutoff axes. Table 1 effectively does this, giving the values of sensitivity and specificity according to different prevalences and standard deviations. As might be expected, the positive and negative predictive values are more strongly associated with prevalence than are sensitivity and specificity. A student might, at this point, ask “When are sensitivity and specificity not related to prevalence?” This can occur when the underlying condition is purely dichotomous, e.g. when a person either carries a gene or does not. Readers are invited to construct a corresponding graph, where individuals have only one of two values on an X-axis; changing the proportions with one or the other values will not affect the sensitivity and specificity of a specified test, even if the test results have a continuous distribution. Data were generated and graphed with Stata 17 (College Station, TX).
References 1. Celentano D, Szklo M, Farag MK. Gordis Epidemiology. 7th ed. Philadelphia, PA: Elsevier; 2024. 2. Ransohoff DF, Feinstein AR. Problems of spectrum and bias in evaluating the efficacy of diagnostic tests. N Engl J Med. 1978;299:926-930. 3. Brenner H, Gefeller O. Variation of sensitivity, specificity, likelihood ratios and predictive values with disease prevalence. Stat Med. 1997;16:981-991. 4. Choi BC. Causal modeling to estimate sensitivity and specificity of a test when prevalence changes. Epidemiology. 1997;8:80-86. 5. Hilden J. Prevalence-free utility-respecting summary indices of diagnostic power do not exist. Stat Med. 2000;19:431-440. 6. Fierz W. Diagnostic sensitivity, specificity, and likelihood ratio dependent on prevalence of disease-underlying cause. Arch Microbio Immuno 2023;7:96-110.
|
|||||||||||||||||||||||||||||||||||||||||||||||||||||||||||||||||||||||||||||||||||||||||||||||||||||||||||||
|
|
|||||||||||||||||||||||||||||||||||||||||||||||||||||||||||||||||||||||||||||||||||||||||||||||||||||||||||||